I’ve been involved in a diverse range of work inside Australia and internationally, including research that has been published in peer-reviewed journals (see here for a list). My work has covered analyses of observational datasets, regional and global climate model simulations, climate simulations of Earth’s geological past and software development. See below for a few examples.
Temperature extremes in rich vs poor countries
Temperature extremes have been increasing over the better part of the last century and will continue to increase under global warming. However, different parts of the world have experienced drastically different rates of increase. The following graph shows that rich countries (red line) have experienced a substantially smaller increase in day time temperature extremes over the past several decades compared to poor countries (blue line). This is due to the fact that the majority of poor countries reside in the tropics, where temperature variability is low. See the research here. This research featured in the Sydney Morning Herald.

Climpact
Climpact is a software tool developed in the R programming language that calculates climate extremes based on daily values of maximum and minimum temperature and daily precipitation. This was developed at the University of New South Wales in cooperation with the World Meteorological Organisation (WMO), for workshops held in developing countries and run by the Expert Team on Sector-specific Climate Indices. While power users interact with Climpact through the command line, a simple graphical user-interface also exists for non-technical users.

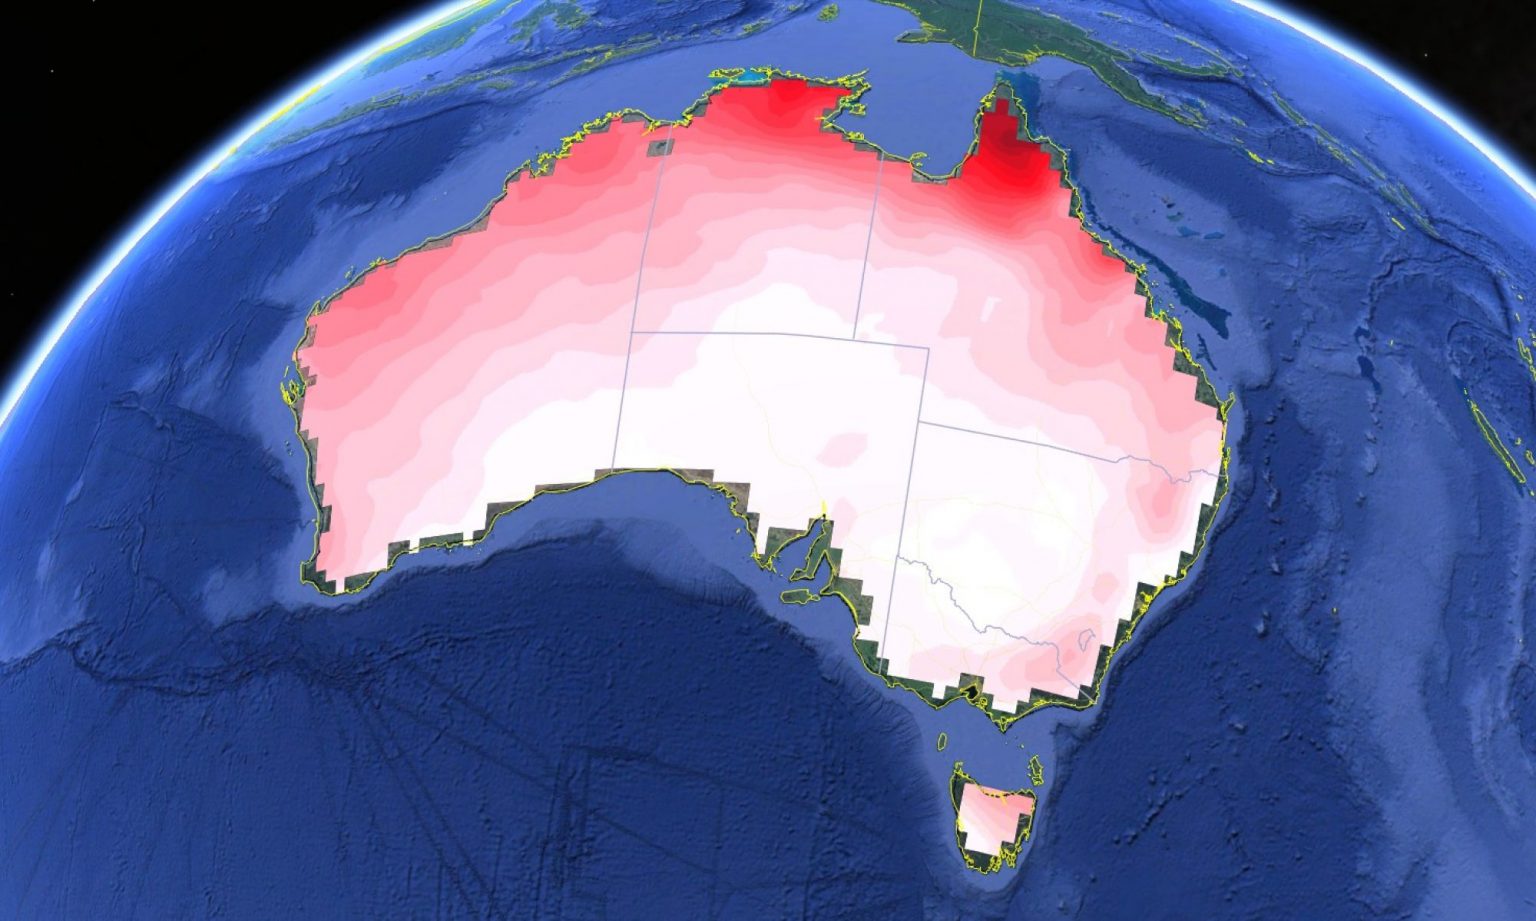
More intense heatwaves due to reduced soil moisture
Colleagues and I have shown that reduced soil moisture is associated with more frequent heatwaves in Australia and more specifically that different ends of the heatwave probability distribution respond differently to changes in soil moisture. When soil moisture is relatively low, it is the mild heatwaves that tend to get hotter (conversely the hotter heatwaves stay the same) and the long heatwaves that tend to get even longer (shorter heatwaves generally do not get longer). See the research here.
The figure below shows regions in Australia where the frequency of summer heatwaves each year are significantly correlated with the level of soil moisture present (grey areas represent regions of poor data-quality).

Measuring the precision of global observations of precipitation extremes
I have been involved in assessing the precision of global precipitation datasets created from gauge and satellite networks that are used in climate impact work and model evaluation. This work shows that current observational datasets can exhibit larger uncertainties than that exhibited by state-of-the-art climate models, which are commonly thought to perform poorly compared to observations. Therefore when using observations in assessing extremes no single dataset should be relied upon, instead several datasets should be used to create an envelope of uncertainty.
The following graph shows the spread of uncertainty in average wet-day precipitation intensity over land in current state-of-the-art climate models (shown in grey shading; interquartile range in dark grey) compared to datasets constrained by observations (individual products in colour). Clearly, in this instance the uncertainties in observations are larger than the uncertainty in models, a sign that improvements in modelled extremes may have trouble being validated. See the research here.

The effect of El Niño and Indian Ocean temperatures on climate
During the El Niño-Southern Oscillation (ENSO) it is typical for the tropical Indian Ocean to warm. Here we show that this warming during extreme El Niño phases actually cools North Africa and South Asia, an area encompassing over three billion people. This is brought about by an upper tropospheric Rossby wave response to warming in the Indian Ocean that propagates polewards. This leads to pressure and cloud fraction changes that cause the cooling. See the research here.
Below is the simulated temperature difference (degrees Kelvin) between an experiment where Indian Ocean warming is included and an experiment where it is excluded. Temperatures over South Asia and North Africa are significantly cooler in the former.

Simulating Earth’s past climates
I have significant experience in conducting global modern and paleo climate simulations. My thesis and postdoctoral work involved simulating Earth’s past climates, from thousands to millions of years before present. Such research, in addition to helping illuminate the history of the Earth, allows the climate models used in global warming studies to be stress tested under different climate conditions. In many of the time periods I have simulated, the vegetation, topography and bathymetry of the Earth were drastically different to the present, all of which needs to be taken into account in the climate model. See my publications for a variety of papers on this topic. Below is the bathymetry and topography of the Earth ~55 million years ago below which needed to be created from published geological and geophysical data and incorporated into our climate model.
Below, the temperature and velocities in the surface layer of the ocean ~15 million years ago, when the continents were approximately in the same location as they are today (note some differences though such as the seaway between Africa and Eurasia).
